Michigan COVID-19 Test Finder
Michigan coronavirus cases: Tracking the pandemic, by Pat Byrne, Brian McNamara, Brian Todd, and Kristi Tanner, Detroit Free Press
Data, Charts, Graphs, Trends, Demographics
91-DIVOC: An interactive visualization of the exponential spread of COVID-19, Fascinating and interactive.
91-DIVOC: COVID-19 Data for Locations of People You Love (Washtenaw County, for example)
Coronavirus COVID-19 Global Cases by the Center for Systems Science and Engineering (CSSE) at Johns Hopkins University (JHU)
The Lancet COVID-19 Resource Center - free
Cumulative Cases - Johns Hopkins University - updated every day, sometimes at about 3:00 AM, sometimes later.
USA Facts: US Coronavirus Cases and Deaths: Track COVID-19 data daily by state and county
This interactive feature aggregates data from the Centers for Disease Control and Prevention (CDC), state- and local-level public health agencies. County-level data is confirmed by referencing state and local agencies directly. Cases, deaths, and per capita adjustments reflect cumulative totals since January 22, 2020.
Detailed Methodology and Sources: COVID-19 Data
Detailed methodology on how USAFacts collects COVID-19 dataPublished on Fri, April 24, 2020 12:00AM PDT | Updated Wed, July 8, 2020 4:38PM PDT
USA Facts: Coronavirus Stats & Data - this data source was funded by Microsoft cofounder Steve Ballmer
12/22/2020 A primer on paradox in medical test statistics, specificity, sensitivity, true and false positive and negative rates, odds vs probability, Prevalence, Prior, and Bayes, Oh my!
10/9/2020 The Coronavirus Unveiled, by Carl Zimmer, The New York Times (computational virology illustrated)
Sept 24, 2020 Modeling between-population variation in COVID-19 dynamics in Hubei, Lombardy, and New York City, by Bryan Wilder, Marie Charpignon, Jackson A. Killian, Han-Ching Ou, Aditya Mate, Shahin Jabbari, Andrew Perrault, Angel N. Desai, Milind Tambe, and Maimuna S. Majumder, PNAS
Sept 9, 2020 Demographic perspectives on the mortality of COVID-19 and other epidemics by Joshua R. Goldstein and Ronald D. Lee, PNAS
To put estimates of COVID-19 mortality into perspective, we estimate age-specific mortality for an epidemic claiming for illustrative purposes 1 million US lives, with results approximately scalable over a broad range of deaths. We calculate the impact on period life expectancy (down 2.94 y) and remaining life years (11.7 y per death). Avoiding 1.75 million deaths or 20.5 trillion person years of life lost would be valued at $10.2 to $17.5 trillion. The age patterns of COVID-19 mortality in other countries are quite similar and increase at rates close to each country’s rate for all-cause mortality. The scenario of 1 million COVID-19 deaths is similar in scale to that of the decades-long HIV/AIDS and opioid-overdose epidemics but considerably smaller than that of the Spanish flu of 1918. Unlike HIV/AIDS and opioid epidemics, the COVID-19 deaths are concentrated in a period of months rather than spread out over decades.
July 28, 2020 Tracking the reach of COVID-19 kin loss with a bereavement multiplier applied to the United States, by Ashton M. Verdery, Emily Smith-Greenaway, Rachel Margolis and Jonathan Daw, PNAS
COVID-19 has created a mortality shock throughout the world, and it may yield a second wave of population health concerns tied to bereavement and social support reductions. We created the COVID-19 bereavement multiplier, an indicator that clarifies one downstream impact of COVID-19 mortality and can be applied to different epidemiological projections of death counts: How many people are at risk for losing a grandparent, parent, sibling, spouse, or child for each COVID-19 death. In the United States, we estimate that on average, under diverse epidemiological circumstances, every death from COVID-19 will leave approximately nine bereaved. Studying how acute mortality crises reverberate through a population in the form of bereavement multipliers expands understandings of the social impacts of health crises.
July 14, 2020 National age and coresidence patterns shape COVID-19 vulnerability, by Albert Esteve, Iñaki Permanyer, Diederik Boertien, and James W. Vaupel, PNAS
April 21, 2020 Projecting hospital utilization during the COVID-19 outbreaks in the United States, by Seyed M. Moghadas, Affan Shoukat, Meagan C. Fitzpatrick, Chad R. Wells, Pratha Sah, Abhishek Pandey, Jeffrey D. Sachs, Zheng Wang, Lauren A. Meyers, Burton H. Singer, and Alison P. Galvani
March 31, 2020 IMpact of international travel and border control measures on the global spread of the novel 2019 coronavirus outbreak, by Chad R. Wells, Pratha Sah, Seyed M. Moghadas, Abhishek Pandey, Affan Shoukat, Yaning Wang, Zheng Wang, Lauren A. Meyers, Burton H. Singer, and Alison P. Galvani, PNAS
To contain the global spread of the 2019 novel coronavirus epidemic (COVID-19), border control measures, such as airport screening and travel restrictions, have been implemented in several countries. Our results show that these measures likely slowed the rate of exportation from mainland China to other countries, but are insufficient to contain the global spread of COVID-19. With most cases arriving during the asymptomatic incubation period, our results suggest that rapid contact tracing is essential both within the epicenter and at importation sites to limit human-to-human transmission outside of mainland China.
The novel coronavirus outbreak (COVID-19) in mainland China has rapidly spread across the globe. Within 2 mo since the outbreak was first reported on December 31, 2019, a total of 566 Severe Acute Respiratory Syndrome (SARS CoV-2) cases have been confirmed in 26 other countries. Travel restrictions and border control measures have been enforced in China and other countries to limit the spread of the outbreak. We estimate the impact of these control measures and investigate the role of the airport travel network on the global spread of the COVID-19 outbreak. Our results show that the daily risk of exporting at least a single SARS CoV-2 case from mainland China via international travel exceeded 95% on January 13, 2020. We found that 779 cases (95% CI: 632 to 967) would have been exported by February 15, 2020 without any border or travel restrictions and that the travel lockdowns enforced by the Chinese government averted 70.5% (95% CI: 68.8 to 72.0%) of these cases. In addition, during the first three and a half weeks of implementation, the travel restrictions decreased the daily rate of exportation by 81.3% (95% CI: 80.5 to 82.1%), on average. At this early stage of the epidemic, reduction in the rate of exportation could delay the importation of cases into cities unaffected by the COVID-19 outbreak, buying time to coordinate an appropriate public health response.
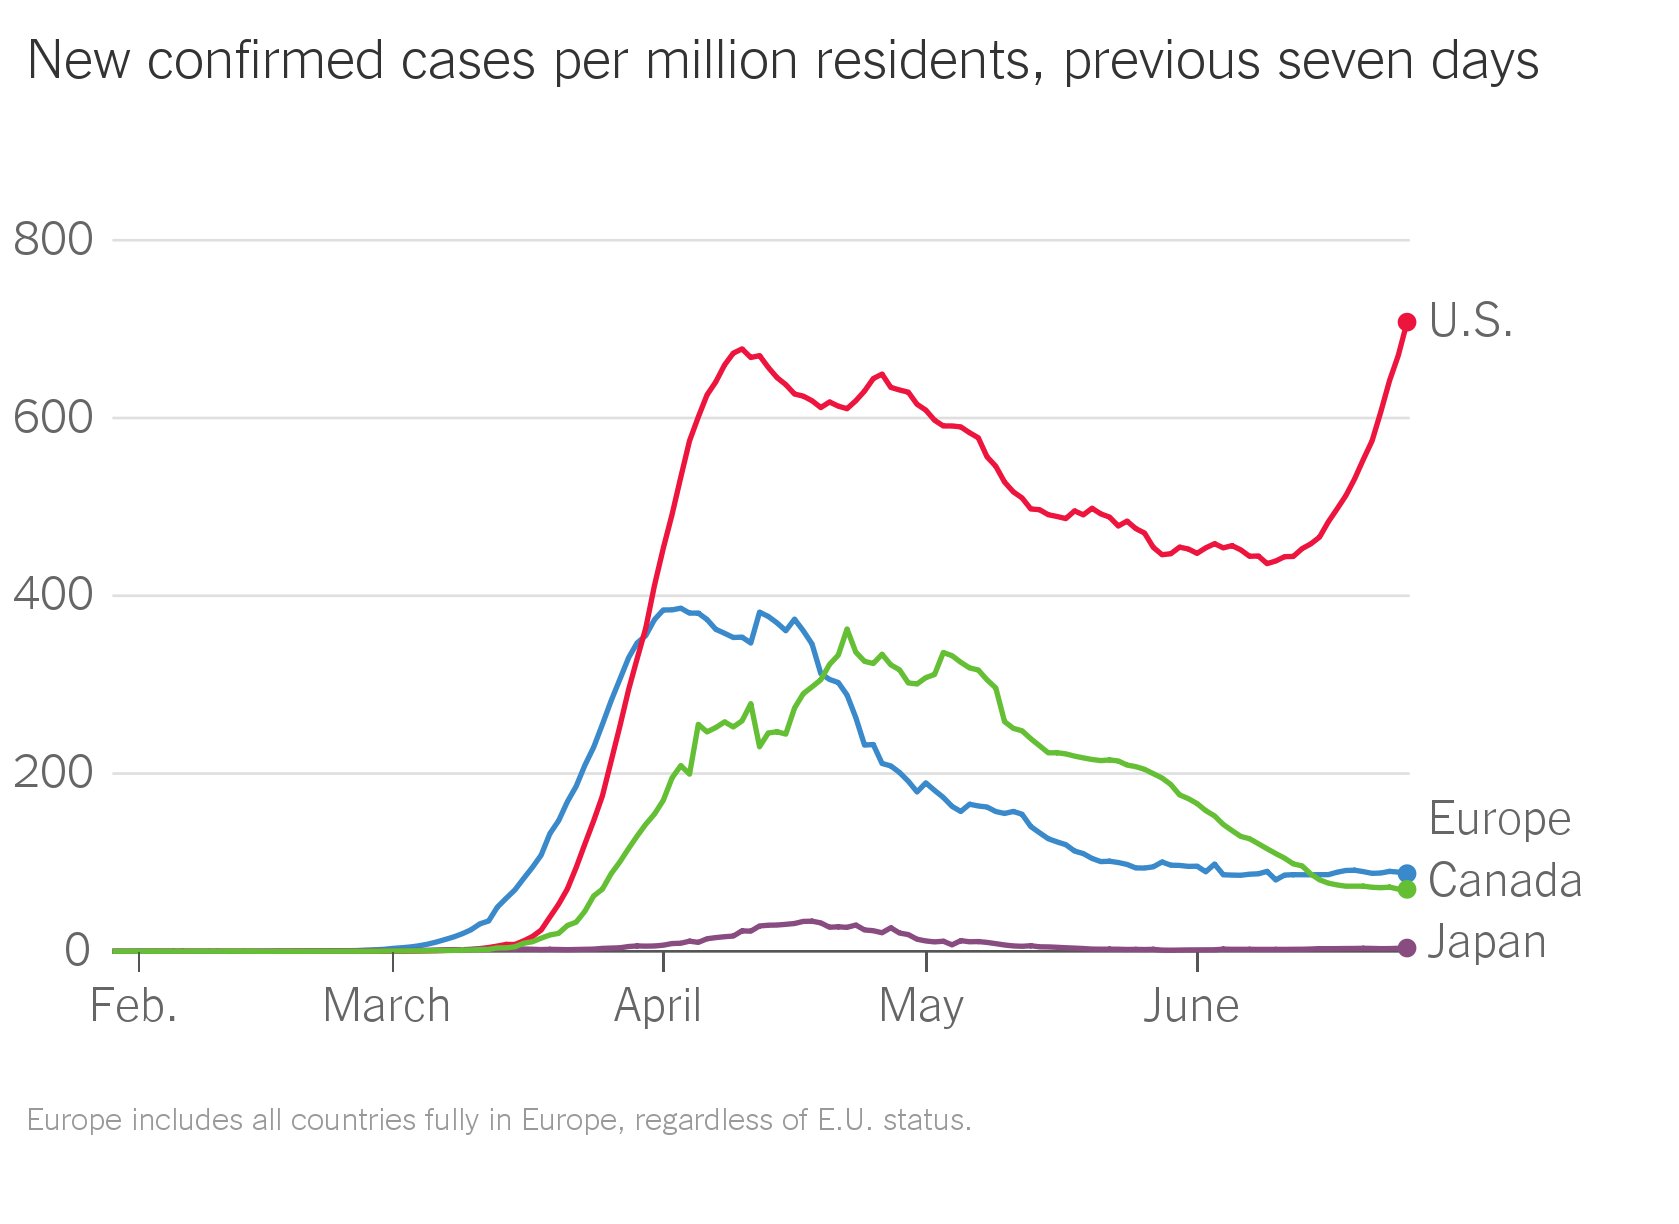
June 29, 2020. American Exceptionalism on the Virus.
The 9/11 death toll was 2,977 people.
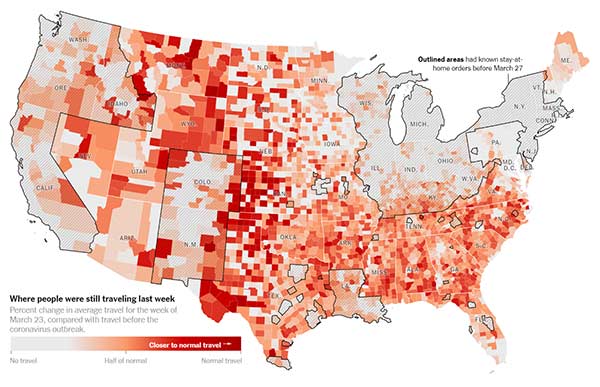
The New York Times: Where America Didn’t Stay Home Even as the Virus Spread, By James Glanz, Benedict Carey, Josh Holder, Derek Watkins, Jennifer Valentino-DeVries, Rick Rojas and Lauren Leatherby, April 2, 2020
Florida waited so long to shut down travel that it will struggle to control local outbreaks even if people immediately change their behavior significantly, said Thomas Hladish, an infectious disease modeler at the University of Florida. People who now sequester themselves at home still risk having brought the virus home to their families, he said.
"A lockdown order right now is not going to be a silver bullet with containing this," Mr. Hladish said. "It will absolutely save lives. But in order to really have a big effect with social-distancing measures, you would have had to move it back in time.”
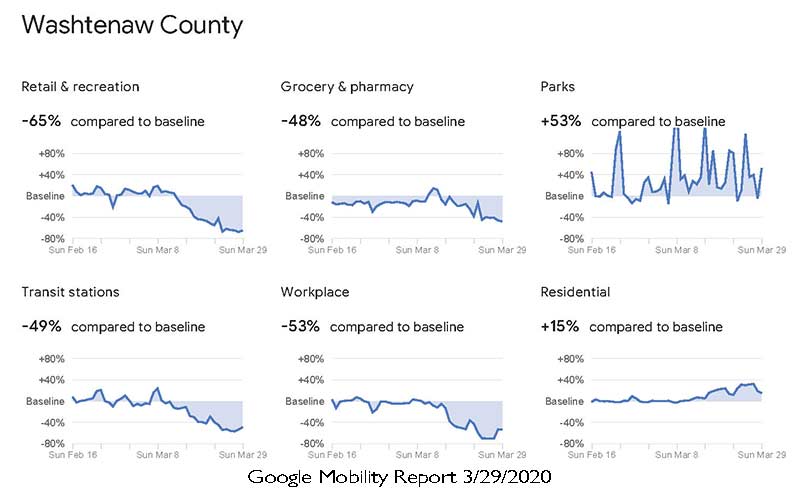
The Verge: Google uses location data to show which places are complying with stay-at-home orders — and which aren’t, by Casey Newton, 4/3/2020
New COVID-19 mobility reports show changes in traffic to stores, parks, transit stations, and more.
Google: Community Mobility Reports 3/29/2020 is the current update
Google: State of Michigan COVID-19 Mobility Report
Statistics Trackers:
Washtenaw County Health Department: COVID-19 Cases in Washtenaw County Updated 4/4/2020
Michigan.Gov statistics, updated daily at 2pm:
CDC: COVID-10: U.S. at a Glance
Worldometers.info Worldometer's COVID-19 data
Detroit Free Press: Michigan coronavirus cases: Tracking the pandemic, 4/17/2020
nCoV2019.live
C19 Coronavirus Statistics
Statnews.com A Covid-19 data tracker
- Click on a country name to get a more detailed geographic breakdown at the state, province, or county level.
The COVID Tracking Project
CNN: More than 150 employees at 4 Boston hospitals have tested positive for coronavirus, Jason Hanna and Ellie Kaufman, 3/27/2020
CNN: Italy records highest daily jump in coronavirus deaths, Sara Spary, Valentina DiDonato, Sharon Braithwaite, 3/27/2020
The number of people who have died of novel coronavirus in Italy has risen by 969 in the past day, the biggest daily jump since the crisis began.
BBC: Coronavirus: A visual guide to the economic impact, Lora Jones, David Brown & Daniele Palumbo, 3/27/2020
MLive: Michigan confirms new coronavirus cases, raising total to 65. Coronavirus is being found in residents across the state, but Wayne County has the most cases of any Michigan county so far, with 17 total. - Malachi Barrett, 3/17/2020
Washington Post - 1/31/2020 Days Events reports
https://www.cnn.com/asia/live-news/coronavirus-outbreak-01-31-20-intl-hnk/index.html